In late 2023, the chess world was gripped by a statistical scandal. A former World Champion published a series of videos pointing to Hikaru Nakamura's 46-game unbeaten streak in online Rapid chess, arguing that the probability of such a run was so infinitesimally small that it constituted mathematical proof of foul play [1].
The accusation rested on a common misunderstanding of probability and chess statistics. To settle the matter, Chess.com commissioned Jeffrey Rosenthal, a Professor of Statistics at the University of Toronto, to conduct an independent analysis of Nakamura's record [2]. Rosenthal's conclusion was definitive: Nakamura's streaks, while impressive, were entirely expected given his rating advantage over his opponents and the sheer volume of games he plays [2].
But the controversy highlighted a broader issue: most chess players do not know what "statistically suspicious" performance actually looks like. When anti-cheat algorithms flag a player, what markers are they looking at? How often do legitimate players play "perfect" games? And what does the data say about how players improve as they climb the rating ladder?
To answer these questions, we analysed a sample of 481 Lichess Rapid games (comprising 962 individual player performances) across rating bands equivalent to Chess.com 800–2000. By running these games through Stockfish 17, we can demystify the statistical markers of fair play and provide a data-driven roadmap for improvement.
The Anatomy of a Cheat Detection Model
When platforms like Chess.com or independent experts like Dr. Kenneth Regan evaluate a player for fair play violations, they do not simply look at whether a player won a lot of games [3]. Instead, they rely on intrinsic performance metrics that measure the quality of the moves played against an engine's evaluation [4].
The two most important metrics are Move Match Rate (how often a player's move matches the engine's top choice) and Average Centipawn Loss (CPL) (how much evaluation a player bleeds per move compared to the engine's best move) [4].
Regan's model combines these into a "Raw Outlier Index" (ROI), scaled so that a score of 50 represents the expected performance for a player's rating, with a standard deviation of 5 [4].
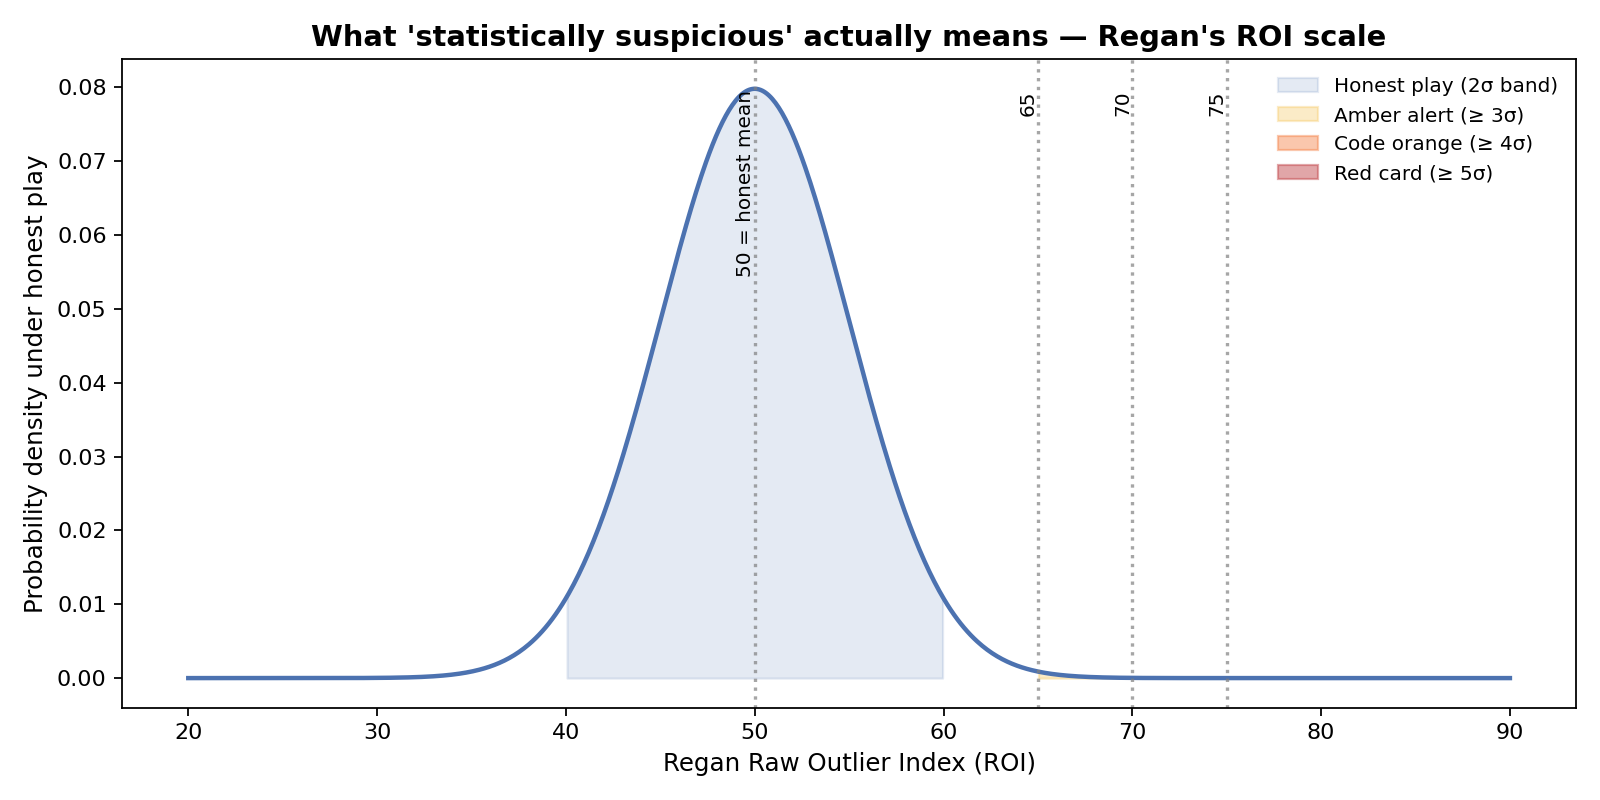
As the chart above illustrates, a performance that is two standard deviations (2σ) better than expected is completely normal—it happens in about 2.5% of honest games [4]. It is only when a player consistently performs at 4σ (Code Orange) or 5σ (Red Card) across multiple games that statistical suspicion is warranted [4]. A single "perfect" game is never enough to trigger a ban, because honest players occasionally play perfect games [3].
The Myth of the "Perfect" Game
One of the most common accusations in amateur chess is that an opponent played "like an engine." But how rare is it for a human to play a game with near-zero centipawn loss?
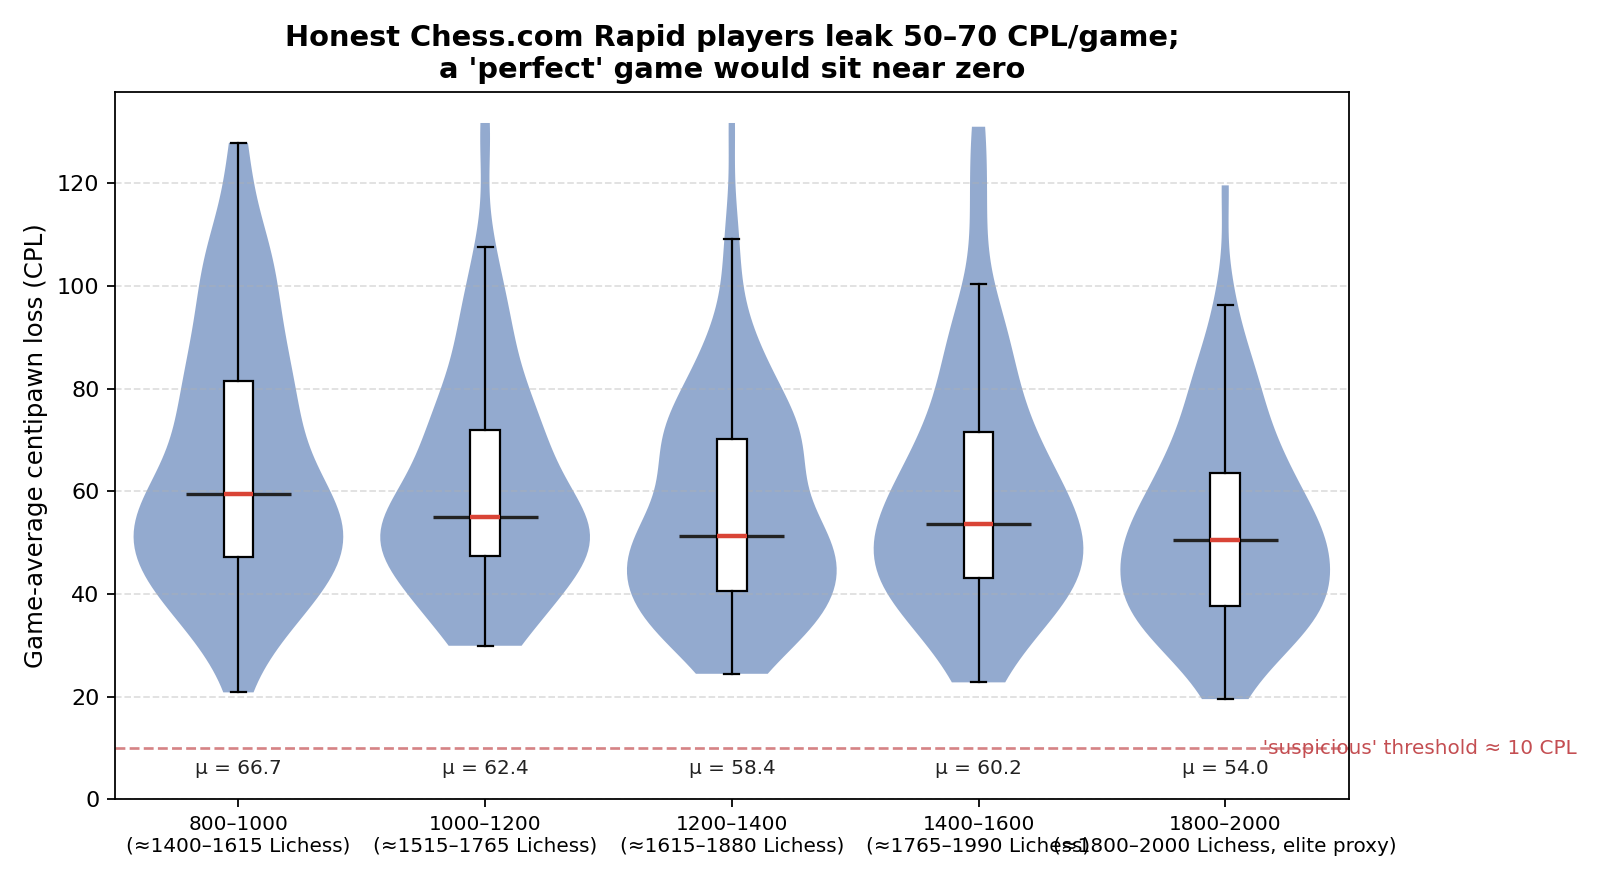
Our analysis of Rapid games reveals that while truly perfect games (0 CPL) are exceedingly rare, "engine-like" performances (≤10 CPL) do occur, particularly in shorter games or when an opponent blunders early, allowing the winning player to simply convert an overwhelming advantage using obvious moves.
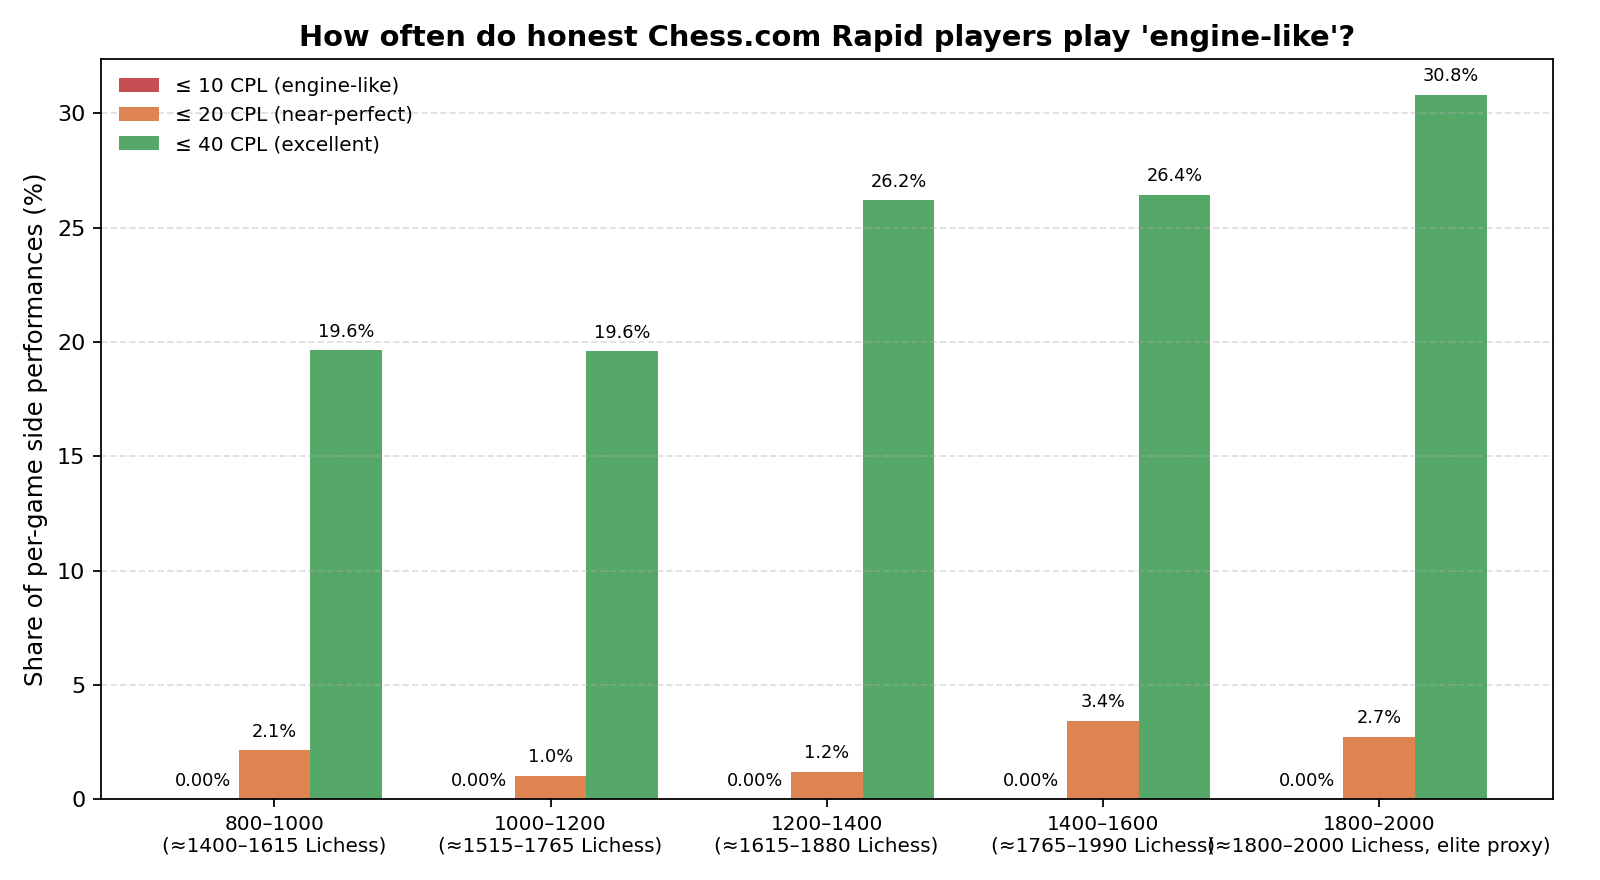
However, as the data shows, the share of games where a player averages ≤10 CPL is effectively zero across all rating bands from 800 to 2000. Even near-perfect games (≤20 CPL) account for less than 4% of performances. What does increase with rating is the frequency of "excellent" games (≤40 CPL), which jumps from 19.6% at the 800–1000 level to 30.8% at the 1800–2000 level.
This highlights a crucial point: strong human play is characterized by a reduction in major blunders, not by achieving 0 CPL.
Visualizing the Difference
Consider the classic Opera Game position below. The human blunder (red arrow) loses the game, while the engine's preferred move (green arrow) maintains the advantage.
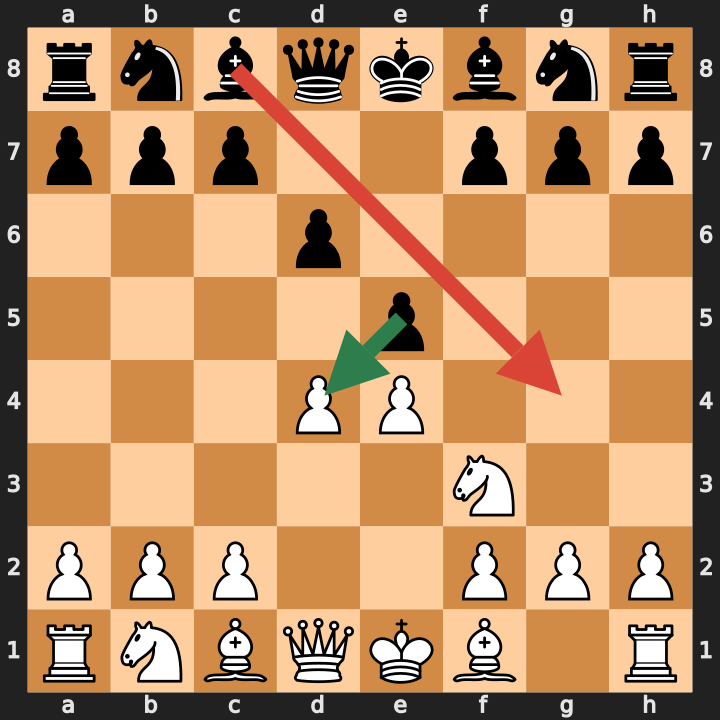
In many positions, the "engine move" is also the most natural human move (e.g., recapturing a piece). Anti-cheat models account for this by weighting the difficulty of the position; matching the engine on an obvious recapture provides no statistical evidence of cheating, whereas matching the engine on a bizarre, counter-intuitive 10-move tactical sequence carries immense weight [4].
The Math of Winning Streaks
Returning to the Nakamura controversy: why did a 46-game unbeaten streak seem impossible to some, but mathematically expected to a statistician?
The answer lies in the difference between "raw probability" and "multiple testing" (the Look-Elsewhere Effect) [2].
If you flip a coin 12 times, the raw probability of getting 12 heads is 1 in 4,096. But if you flip a coin 10,000 times, the probability that you will get a streak of 12 heads somewhere in that sequence is nearly guaranteed [2].
Nakamura has played over 57,000 games on Chess.com [2]. When Rosenthal analysed the 46-game streak, he found that given Nakamura's rating advantage over his opponents in those specific games, his expected score per game was incredibly high [2].
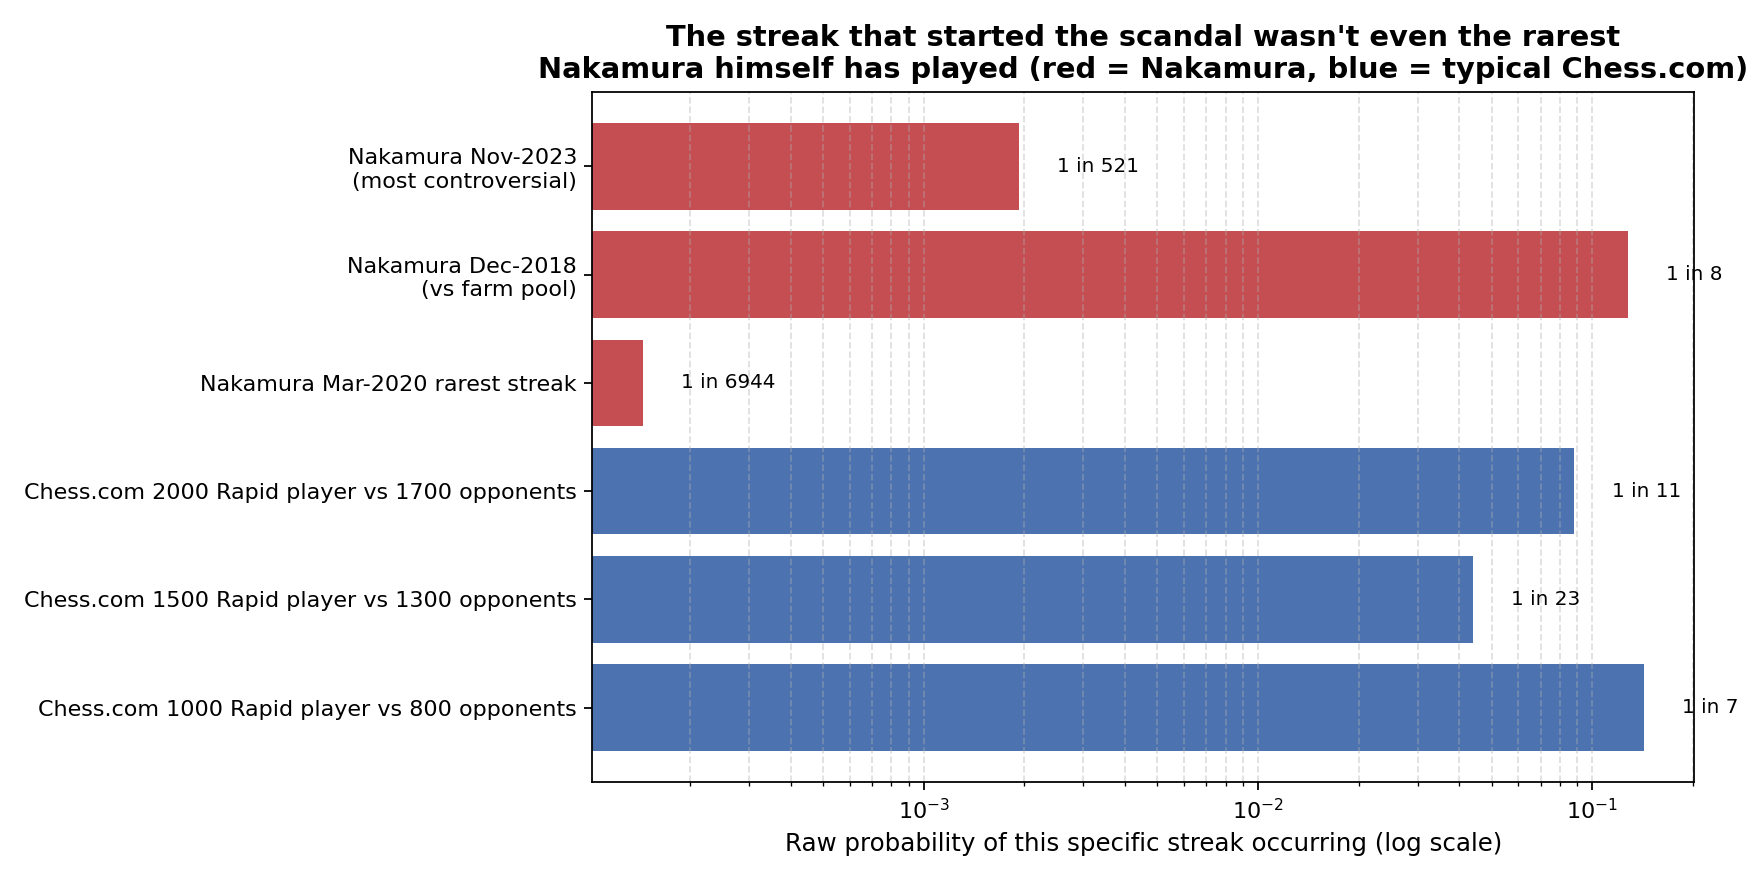
As the chart demonstrates, the raw probability of Nakamura's 46-game streak was about 1 in 521 [2]. Given that he has played tens of thousands of games, a 1-in-521 event is not just possible; it is statistically inevitable [2]. In fact, Nakamura has had even rarer streaks against weaker "farm" pools, including a 121-game unbeaten run where his per-game win probability was 99.98% [2].
We computed similar probabilities for typical Chess.com Rapid players. A 1500-rated player facing a pool of 1300-rated opponents has about a 1-in-23 chance of stringing together a 10-game unbeaten streak. Over a lifetime of hundreds of games, every player will experience streaks that feel "impossible" in the moment.
A Data-Driven Roadmap for Improvement
Our engine analysis of Rapid games across rating bands reveals clear trends in how players improve. By understanding where your rating band leaks centipawns, you can target your training effectively.
800–1200: The Blunder Years
Players in this band average over 60 CPL per game and commit nearly 3 blunders (moves losing ≥300cp) per game.
- Actionable Advice: At this level, games are decided by hanging pieces and missed one-move tactics. Do not worry about opening theory or engine-like precision. Focus entirely on board vision: before every move, ask "is my piece safe?" and "what is my opponent threatening?"
1200–1600: The Consistency Gap
Here, average CPL drops to the high 50s, and blunders decrease to roughly 2.5 per game. Players are finding the "excellent" (≤40 CPL) range more frequently (up to 26% of the time).
- Actionable Advice: You are no longer hanging pieces outright, but you are likely miscalculating 2-3 move combinations or misunderstanding positional transitions. Focus on tactical calculation (puzzle solving) and basic endgame technique.
1600–2000: The Precision Squeeze
At the 1800–2000 level, average CPL drops to 54, and blunders fall to 2.1 per game. Over 30% of performances are now in the "excellent" range.
- Actionable Advice: The margins are tightening. Games are increasingly decided by accumulated inaccuracies (50-99cp) rather than outright blunders. To progress here, you must deepen your opening repertoire to reach playable middlegames, and study positional concepts (pawn structures, weak squares) to squeeze advantages without relying on your opponent to blunder.
Conclusion
Statistical analysis of chess games is a powerful tool, both for catching bad actors and for understanding our own play. But as the Nakamura investigation showed, human intuition about probability is deeply flawed. A 46-game winning streak or a game with 15 CPL might feel like definitive proof of cheating, but in the context of thousands of games and varying opponent strengths, they are simply the extreme edges of a normal distribution.
The data shows that honest players do not play like engines. They leak centipawns, they blunder, and they go on lucky streaks. The path to improvement is not about achieving 0 CPL; it is about slowly, methodically pushing your average CPL down by eliminating the most egregious errors.
Chess Coach, April 17, 2026
Data and Methodology
This analysis was conducted using a sample of 481 Lichess Rapid games (time controls with a base of ≥8 minutes), mapped to Chess.com rating equivalents using a standard conversion table (Lichess ratings are typically 200-300 points higher in the amateur bands). Games were evaluated using Stockfish 17 to compute per-ply centipawn loss from the side-to-move's perspective.
Streak probabilities were calculated using the logistic expected-score and draw-probability models fitted by Rosenthal (2025) to Chess.com data.
Underlying Data Files:
- Per-Game Statistics (CSV)
- Per-Side CPL Data (CSV)
- Band Summary Statistics (CSV)
- Streak Probabilities (CSV)
References
[1] Kramnik, V. (2024). Various public statements and videos regarding online chess statistics. [2] Rosenthal, J. S. (2025). Statistical Analysis of Hikaru Nakamura’s Chess.com Game Record. Harvard Data Science Review. [3] Chess.com. (2024). Chess.com Fair Play Policy and Methodology. [4] Regan, K. W. (2023). Fraught Issues in Statistical Chess Cheating Detection. Physics Colloquium, Vanderbilt University.