Most chess players assume that improvement should look like a steady, upward-sloping line. You study tactics, you play games, and your rating goes up. However, when we look at the actual rating histories of hundreds of active players, the reality is far more chaotic. Real improvement is characterized by sudden spikes, agonizing plateaus, and brutal regressions.
In this data-driven guide, we analyze the rating trajectories of over 200 active Bullet chess players, encompassing more than 158,000 daily rating data points. By examining this data, we can answer critical questions about what normal improvement actually looks like, how common massive rating drops are, and what you can do to navigate the turbulent journey from beginner to advanced levels.
The Myth of Linear Improvement
When we visualize the actual rating trajectories of players across different skill levels, the non-linear nature of chess improvement becomes immediately apparent. The chart below displays six real player trajectories, normalized to approximate Chess.com ratings.
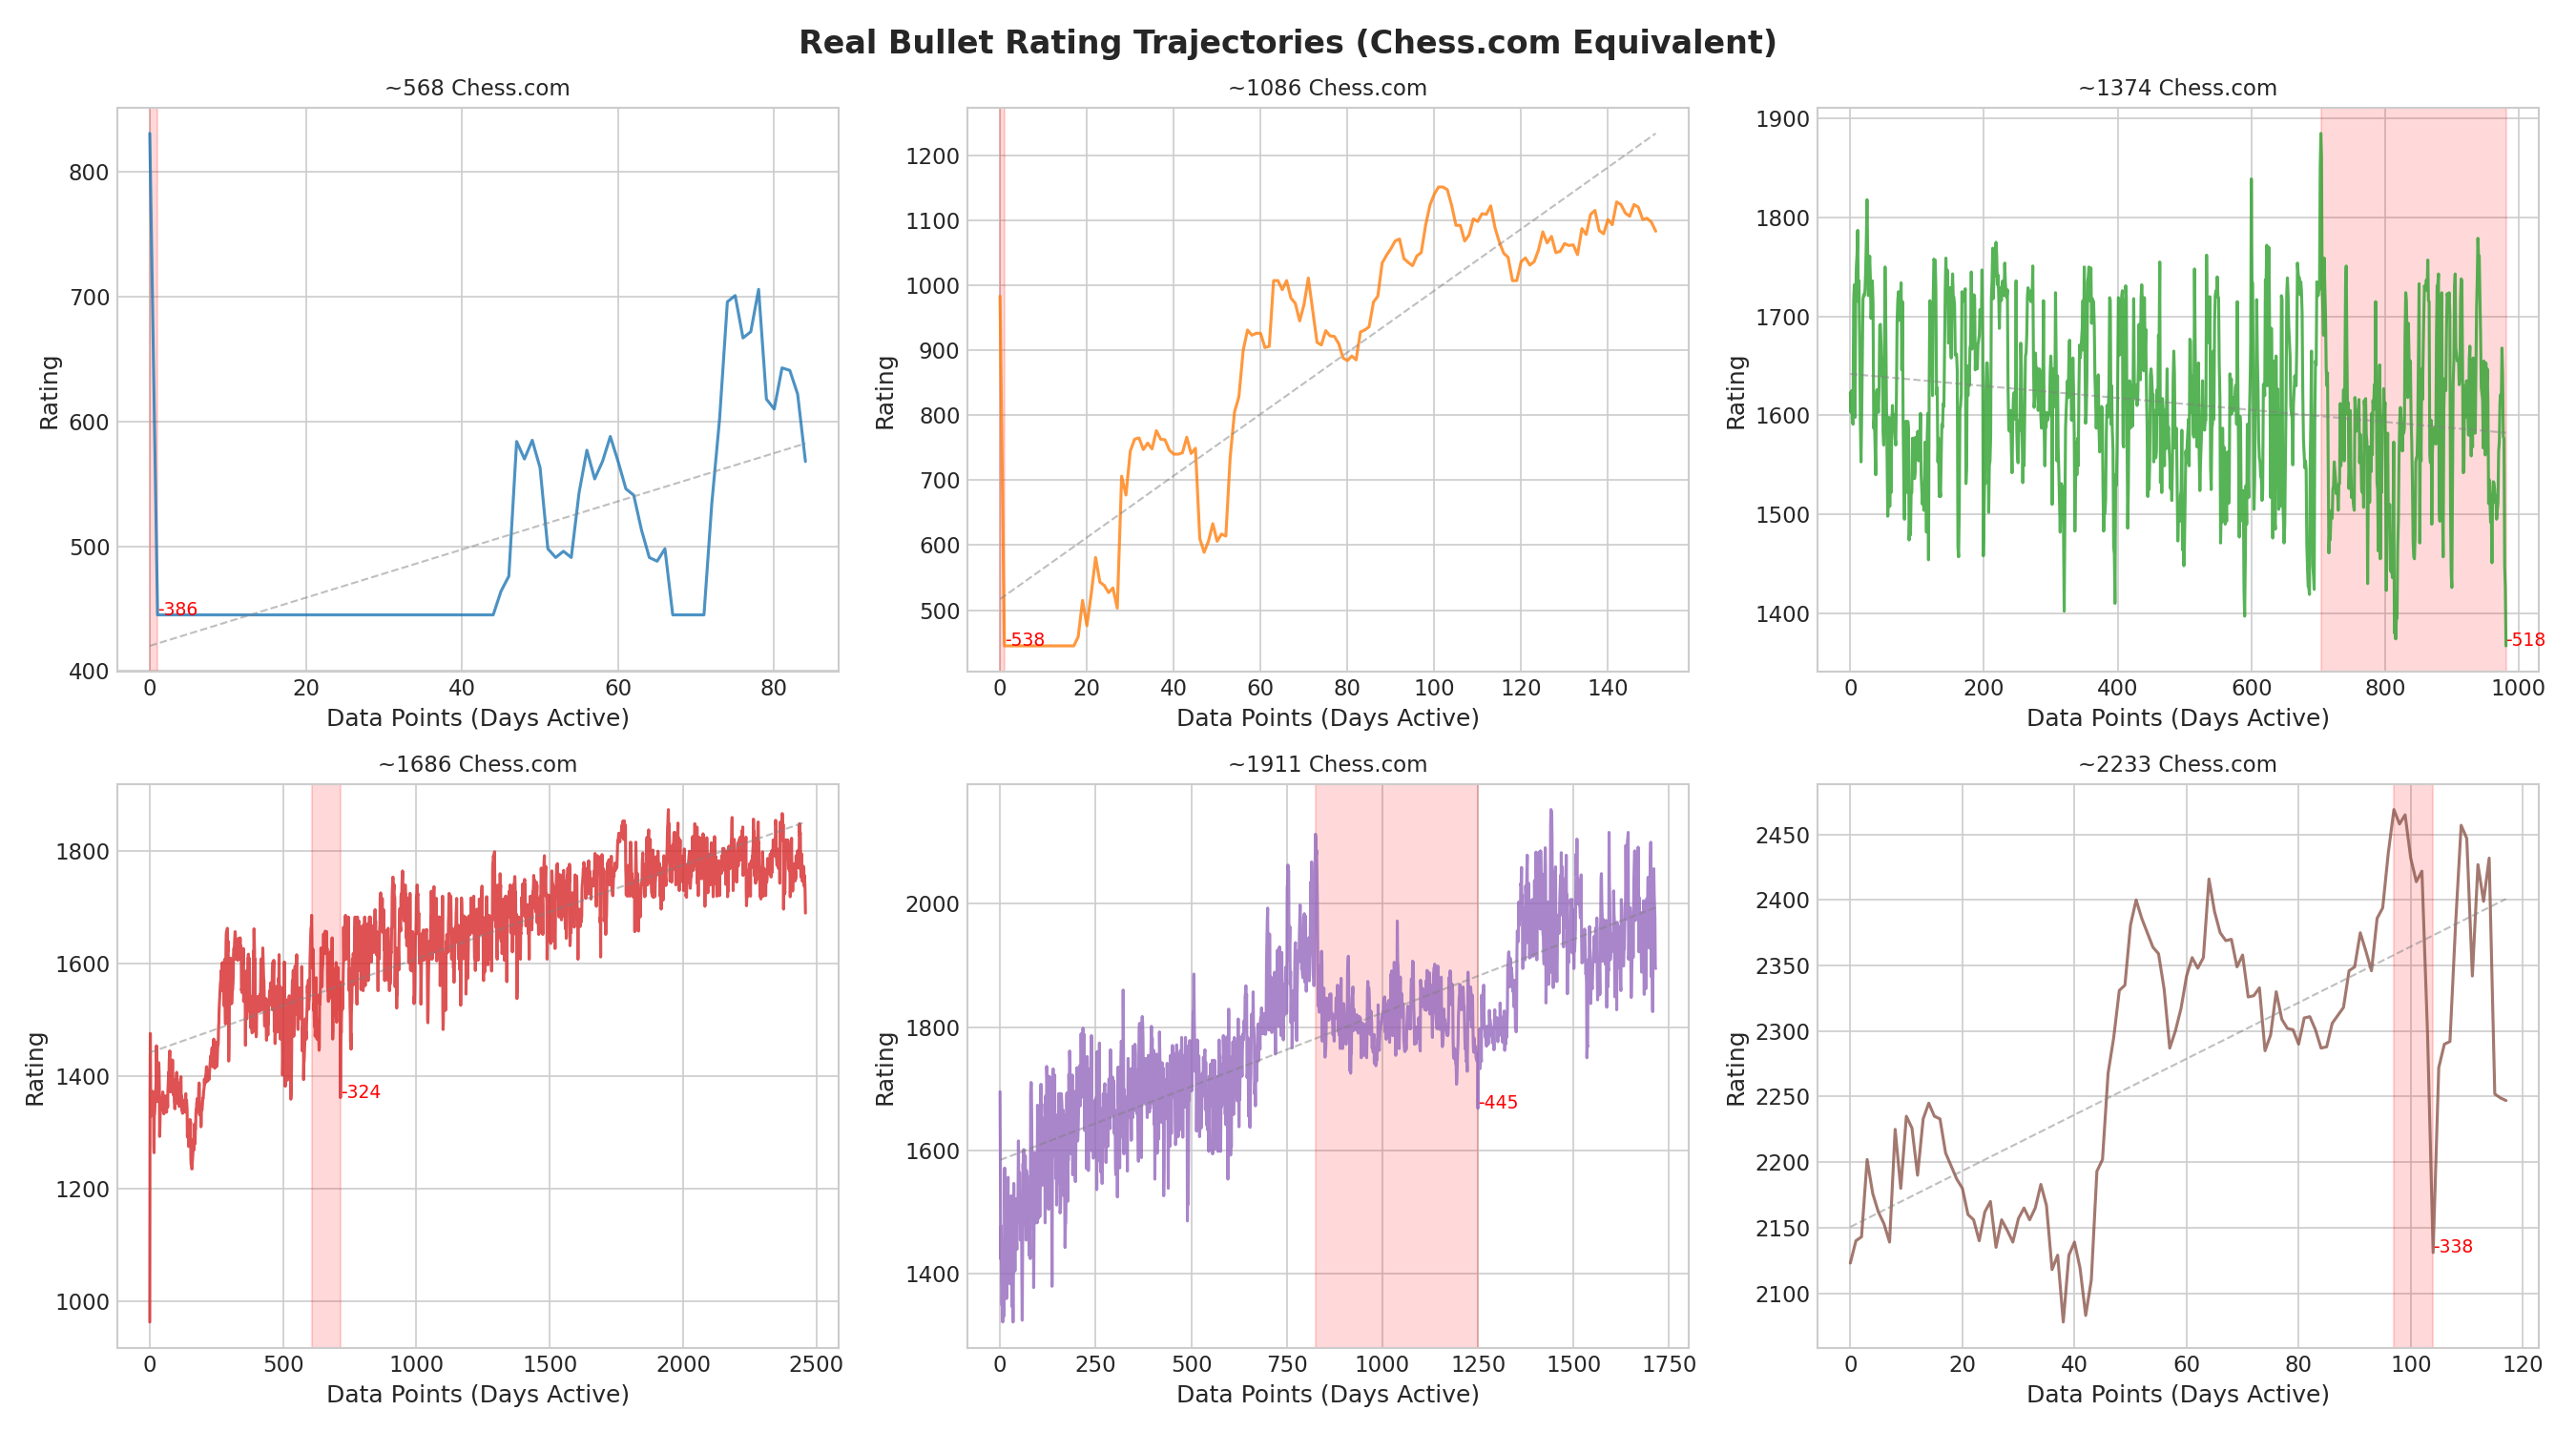
As the data shows, players do not simply gain a few points every day. Instead, they experience periods of rapid growth followed by significant corrections. The red shaded areas highlight the maximum drawdowns—periods where a player's rating plummeted from a recent peak. Notice that even players who successfully climbed hundreds of points over time still endured brutal losing streaks along the way.
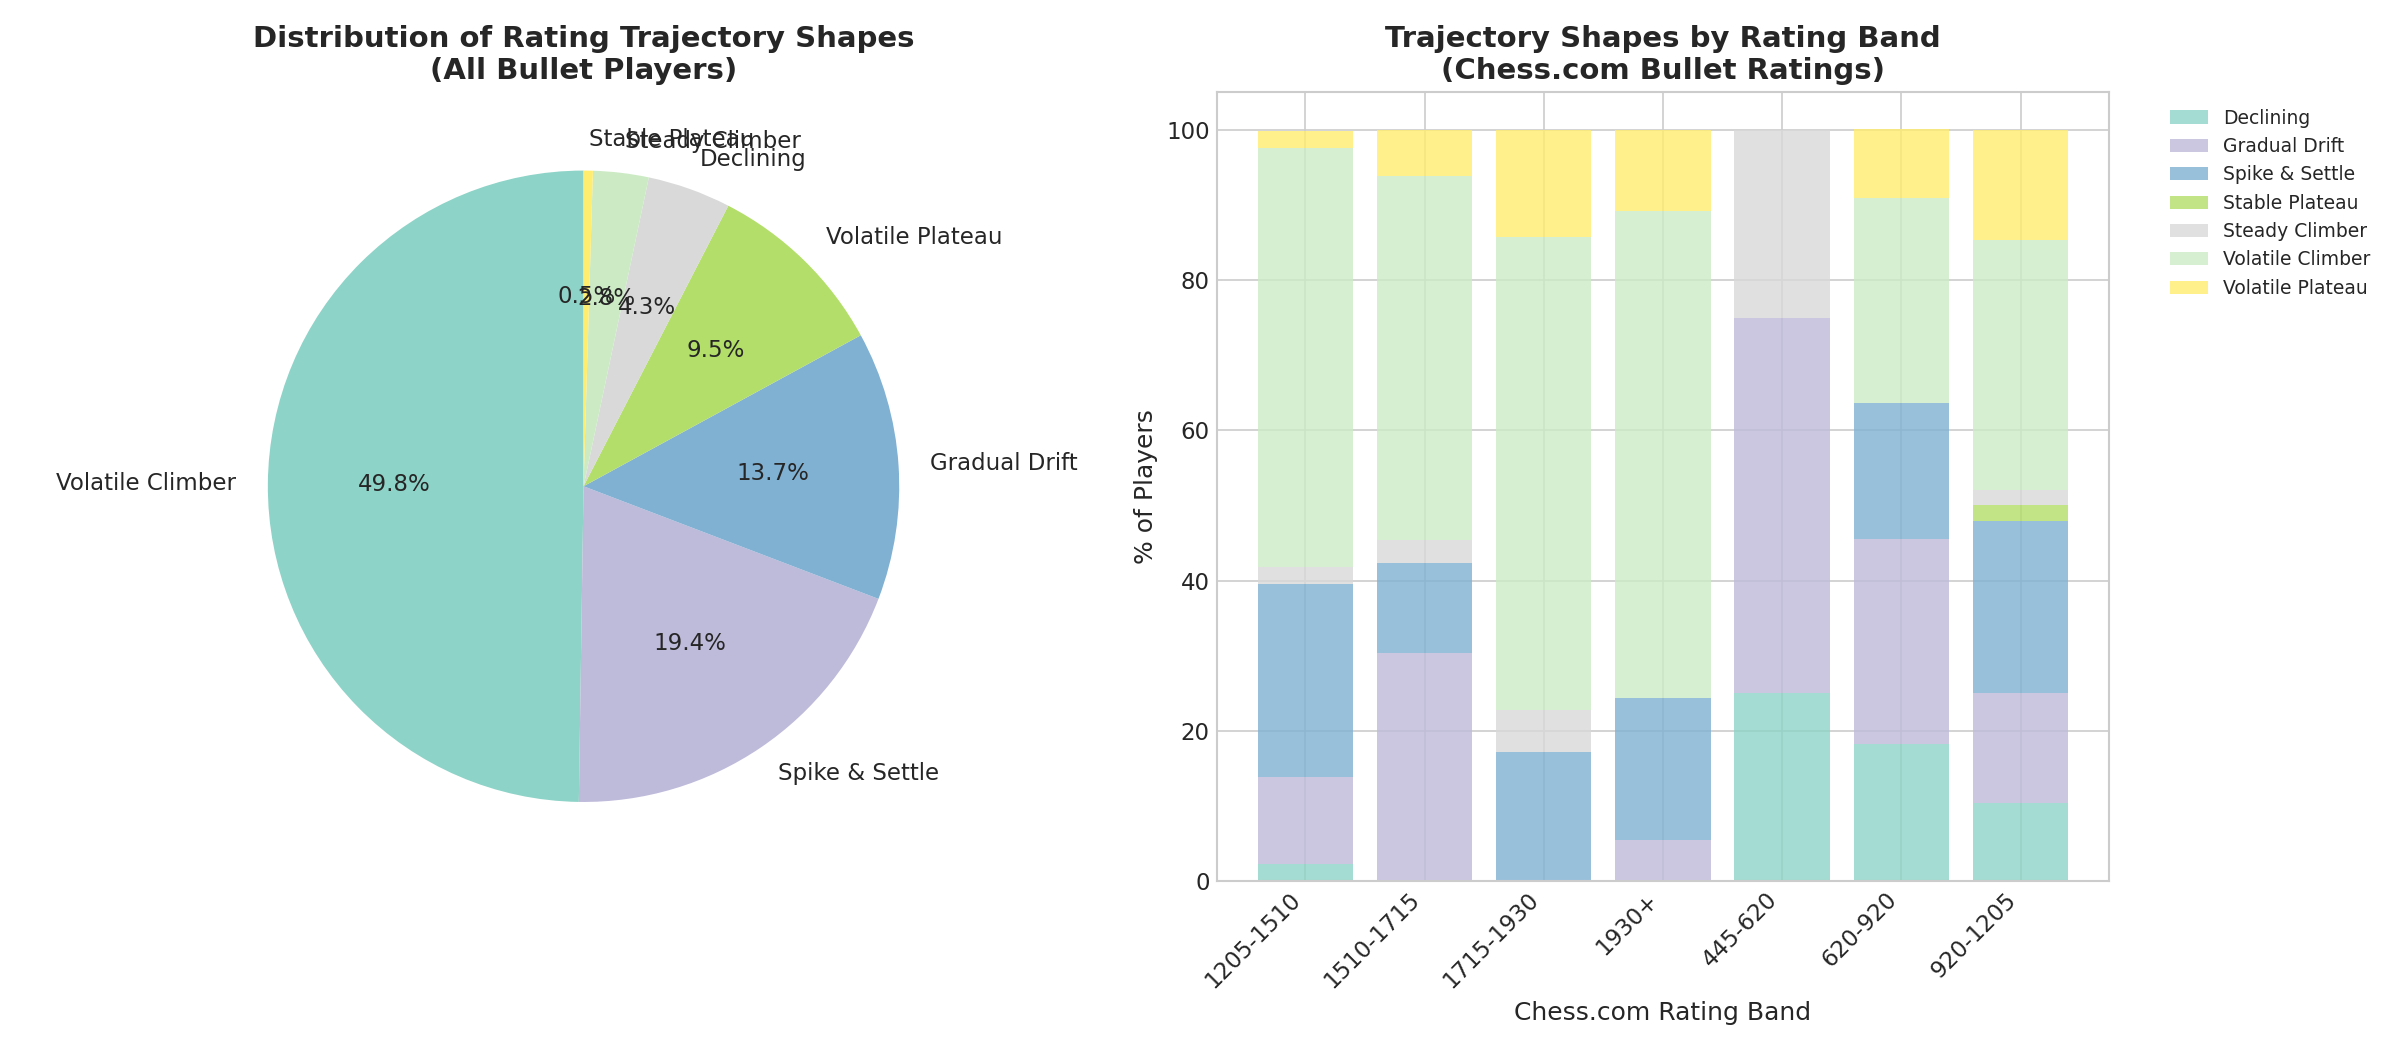
Our analysis categorizes these trajectories into several distinct shapes. The most common pattern across almost all rating bands is the "Volatile Climber," representing players who trend upward but experience wild swings in the process. The "Spike & Settle" pattern is also prevalent, where a player gains a chunk of rating quickly and then spends months oscillating around that new level.
The Reality of Rating Regressions
One of the most demoralizing experiences in chess is the rating regression—losing 100 or more points that you worked hard to gain. Many players assume that such a drop indicates they are getting worse at the game. The data tells a completely different story: massive rating drops are a universal part of the chess experience.
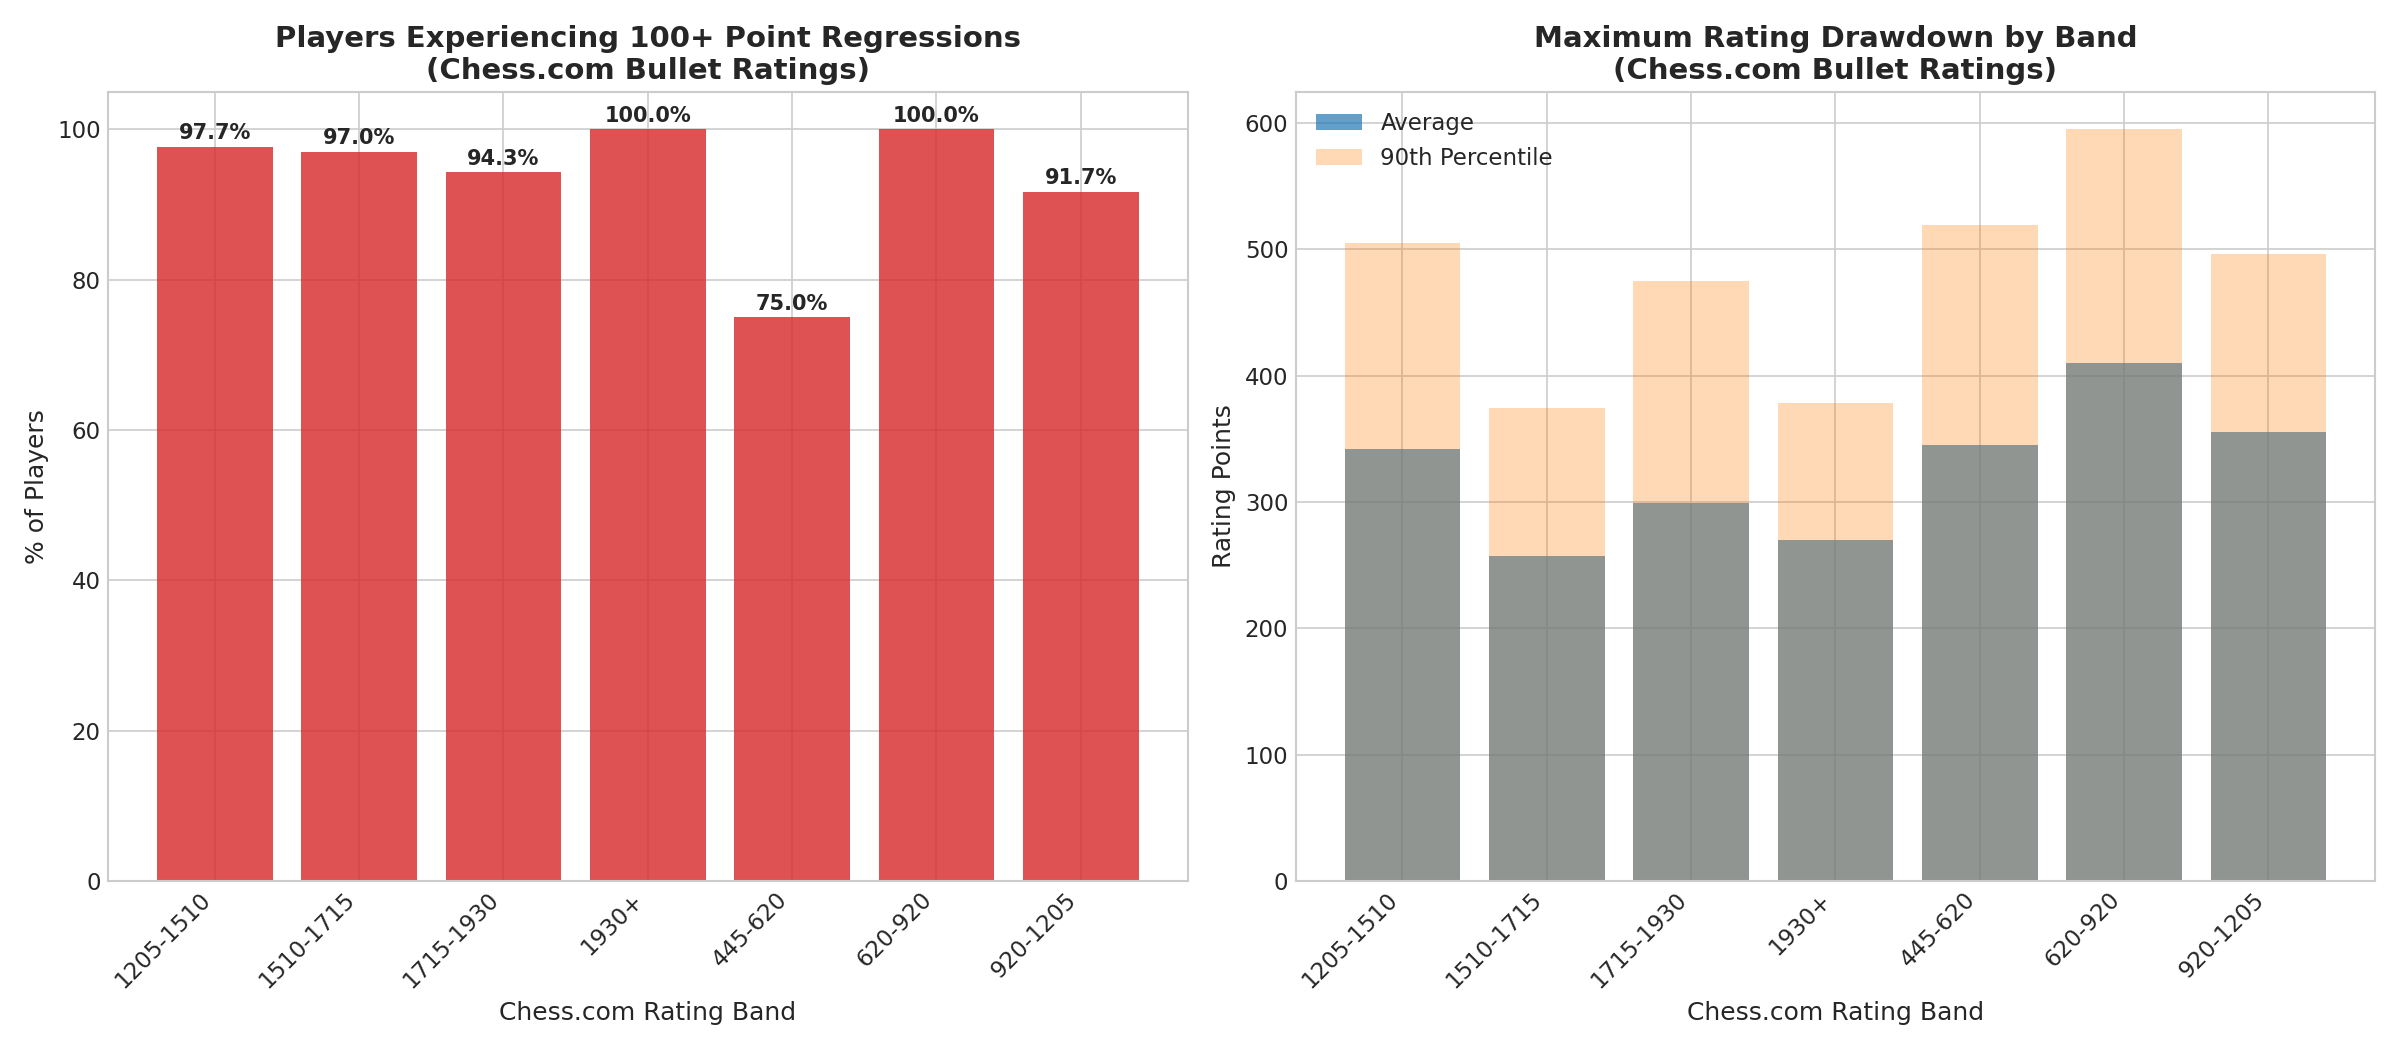
Our analysis reveals that between 75% and 100% of players in every rating band have experienced a regression of at least 100 points. Even among players rated 1930+ (Chess.com equivalent), 100% of our sample had suffered a 100+ point drop at some point in their history.
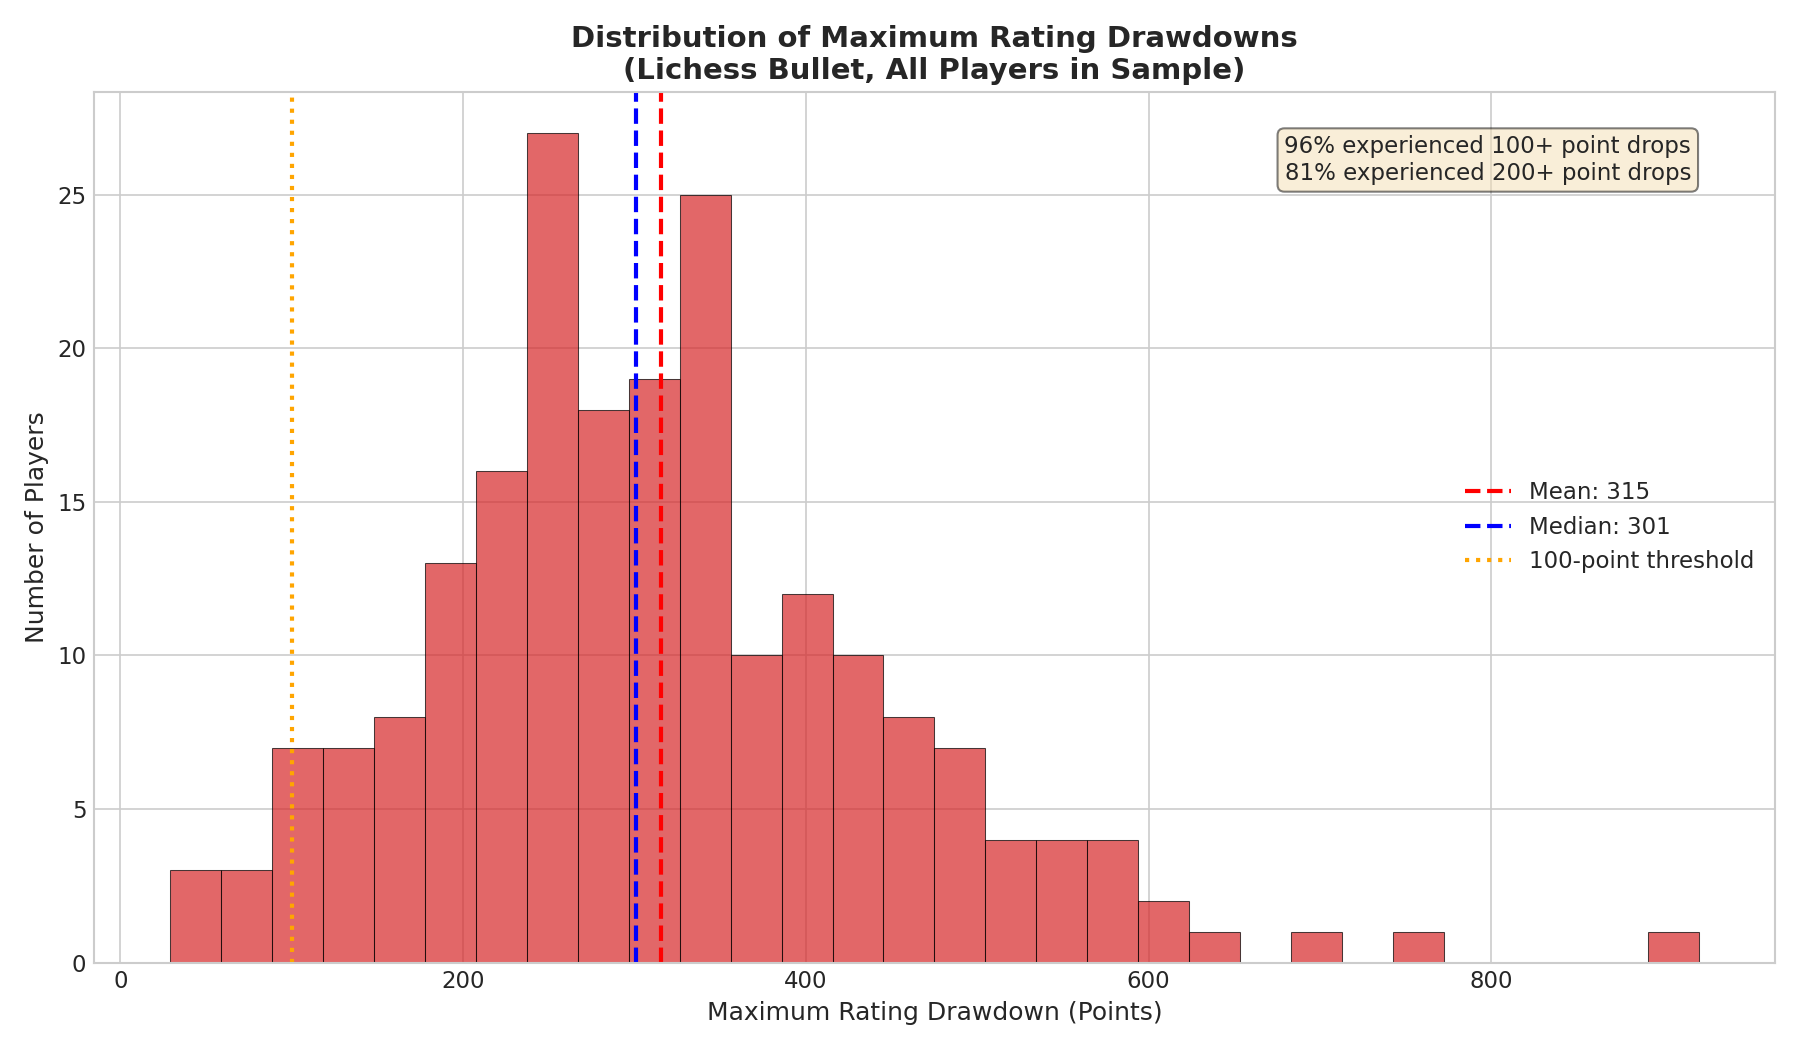
The average maximum drawdown across all players was a staggering 315 points. This means that if you peak at 1200, it is entirely statistically normal to fall back to 900 before climbing again.
Why Do Regressions Happen?
Regressions in Bullet chess are often driven by tilt—the psychological state of playing worse because you are frustrated by previous losses. Our analysis of streak effects shows a clear correlation between losing streaks and subsequent performance.
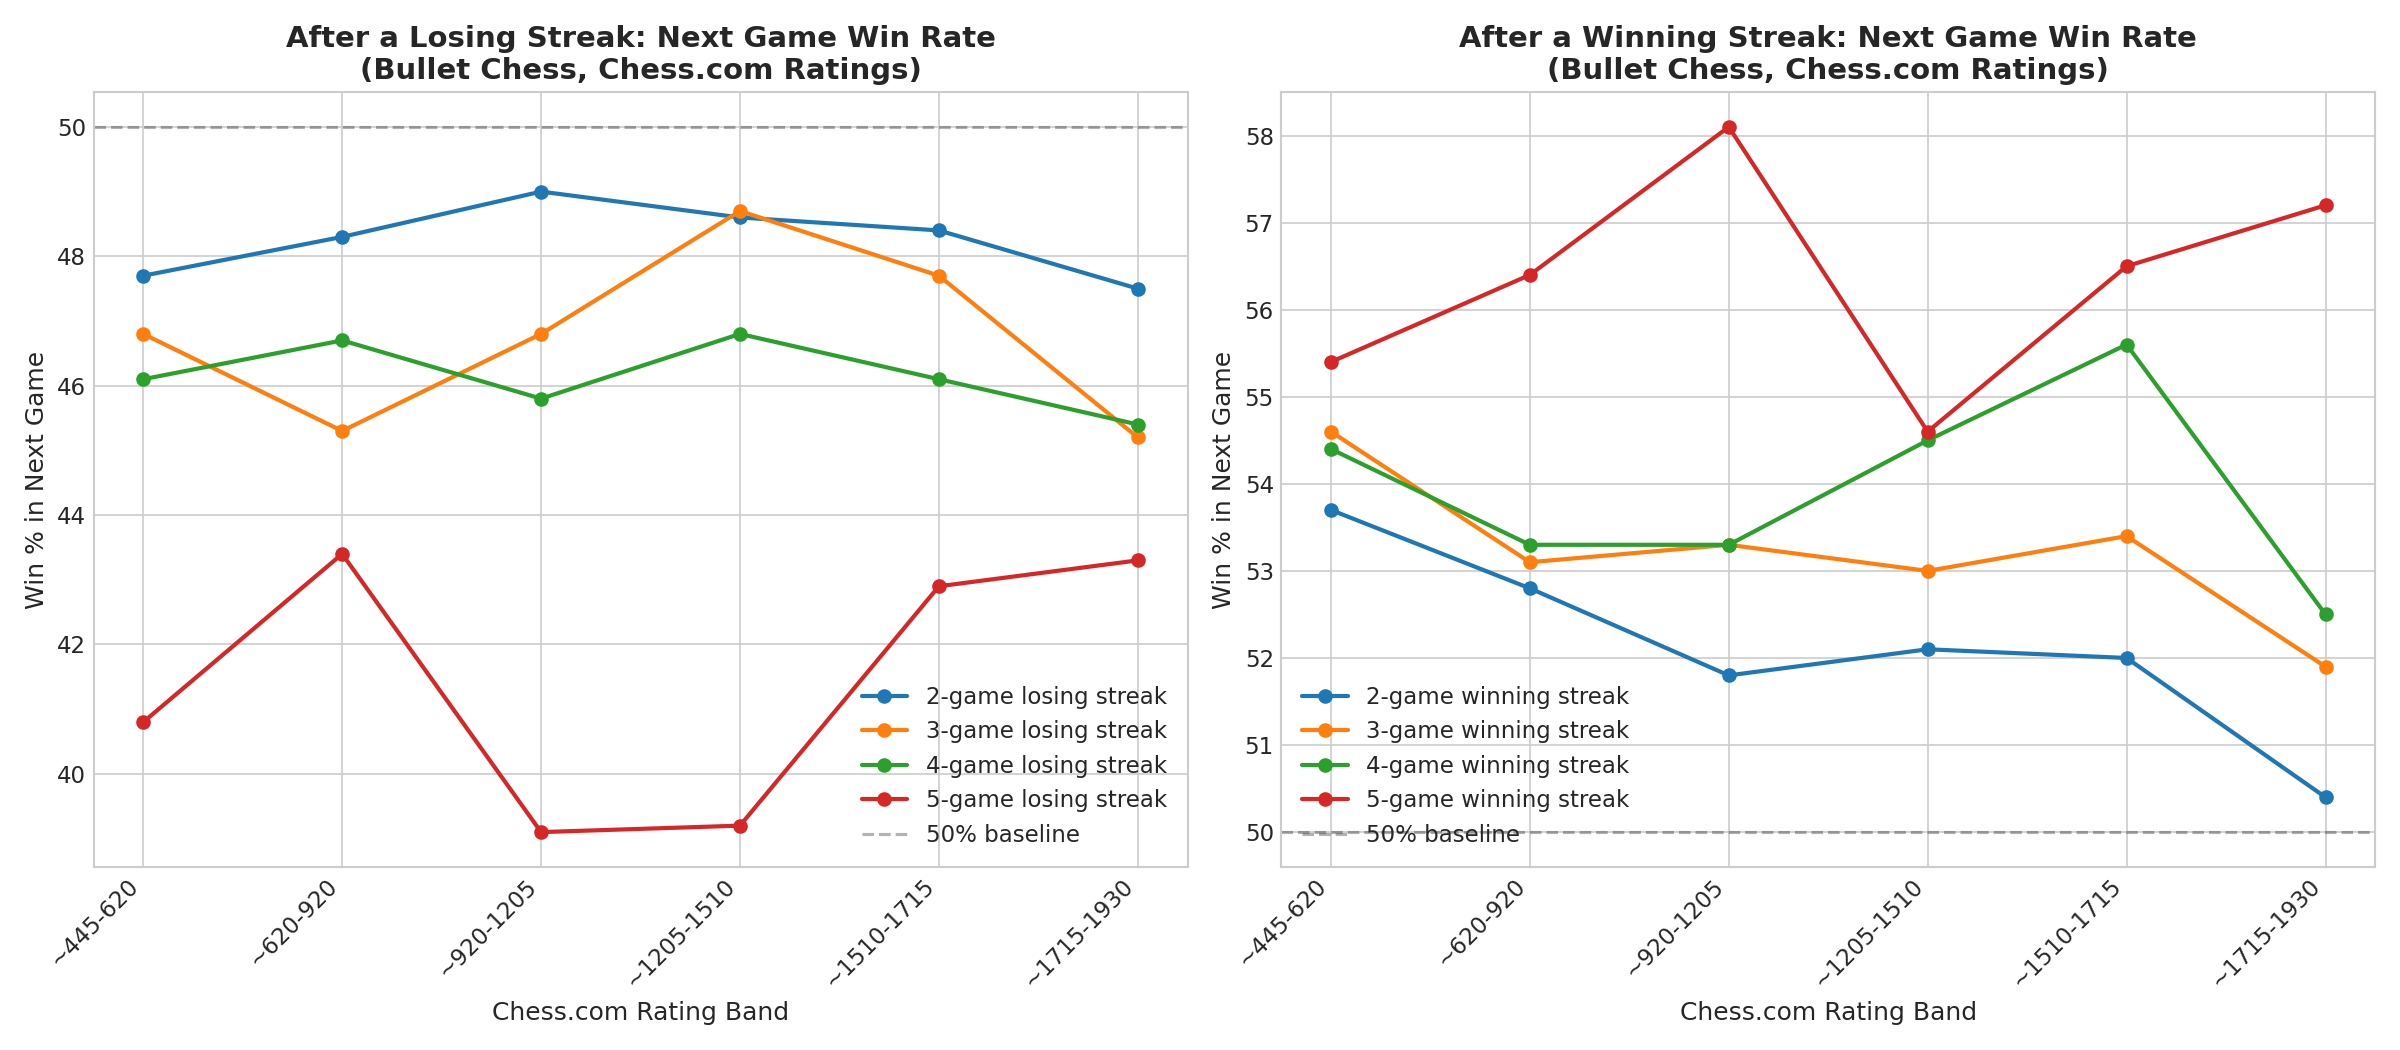
As players accumulate losses, their win percentage in the next game drops significantly below the 50% baseline. This effect is particularly pronounced in the lower rating bands, where emotional regulation and tilt management are less developed.
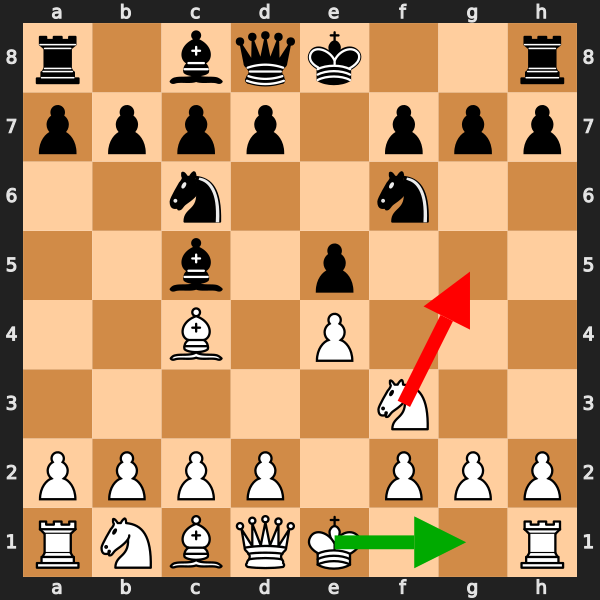
To illustrate how tilt manifests on the board, consider the following position. A player on tilt will often lash out aggressively rather than playing objectively sound chess.
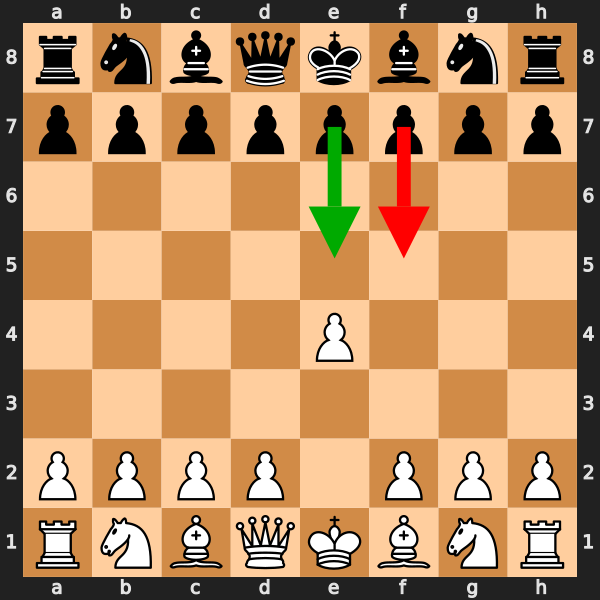 In this position, a tilted player might impulsively push f5 (red arrow), weakening their king and overextending, rather than playing the solid, developing move e5 (green arrow).
Improvement Spikes and Plateaus
If regressions are the valleys of the chess journey, improvement spikes are the peaks. Our data shows that players often gain rating in sudden bursts rather than gradual increments.
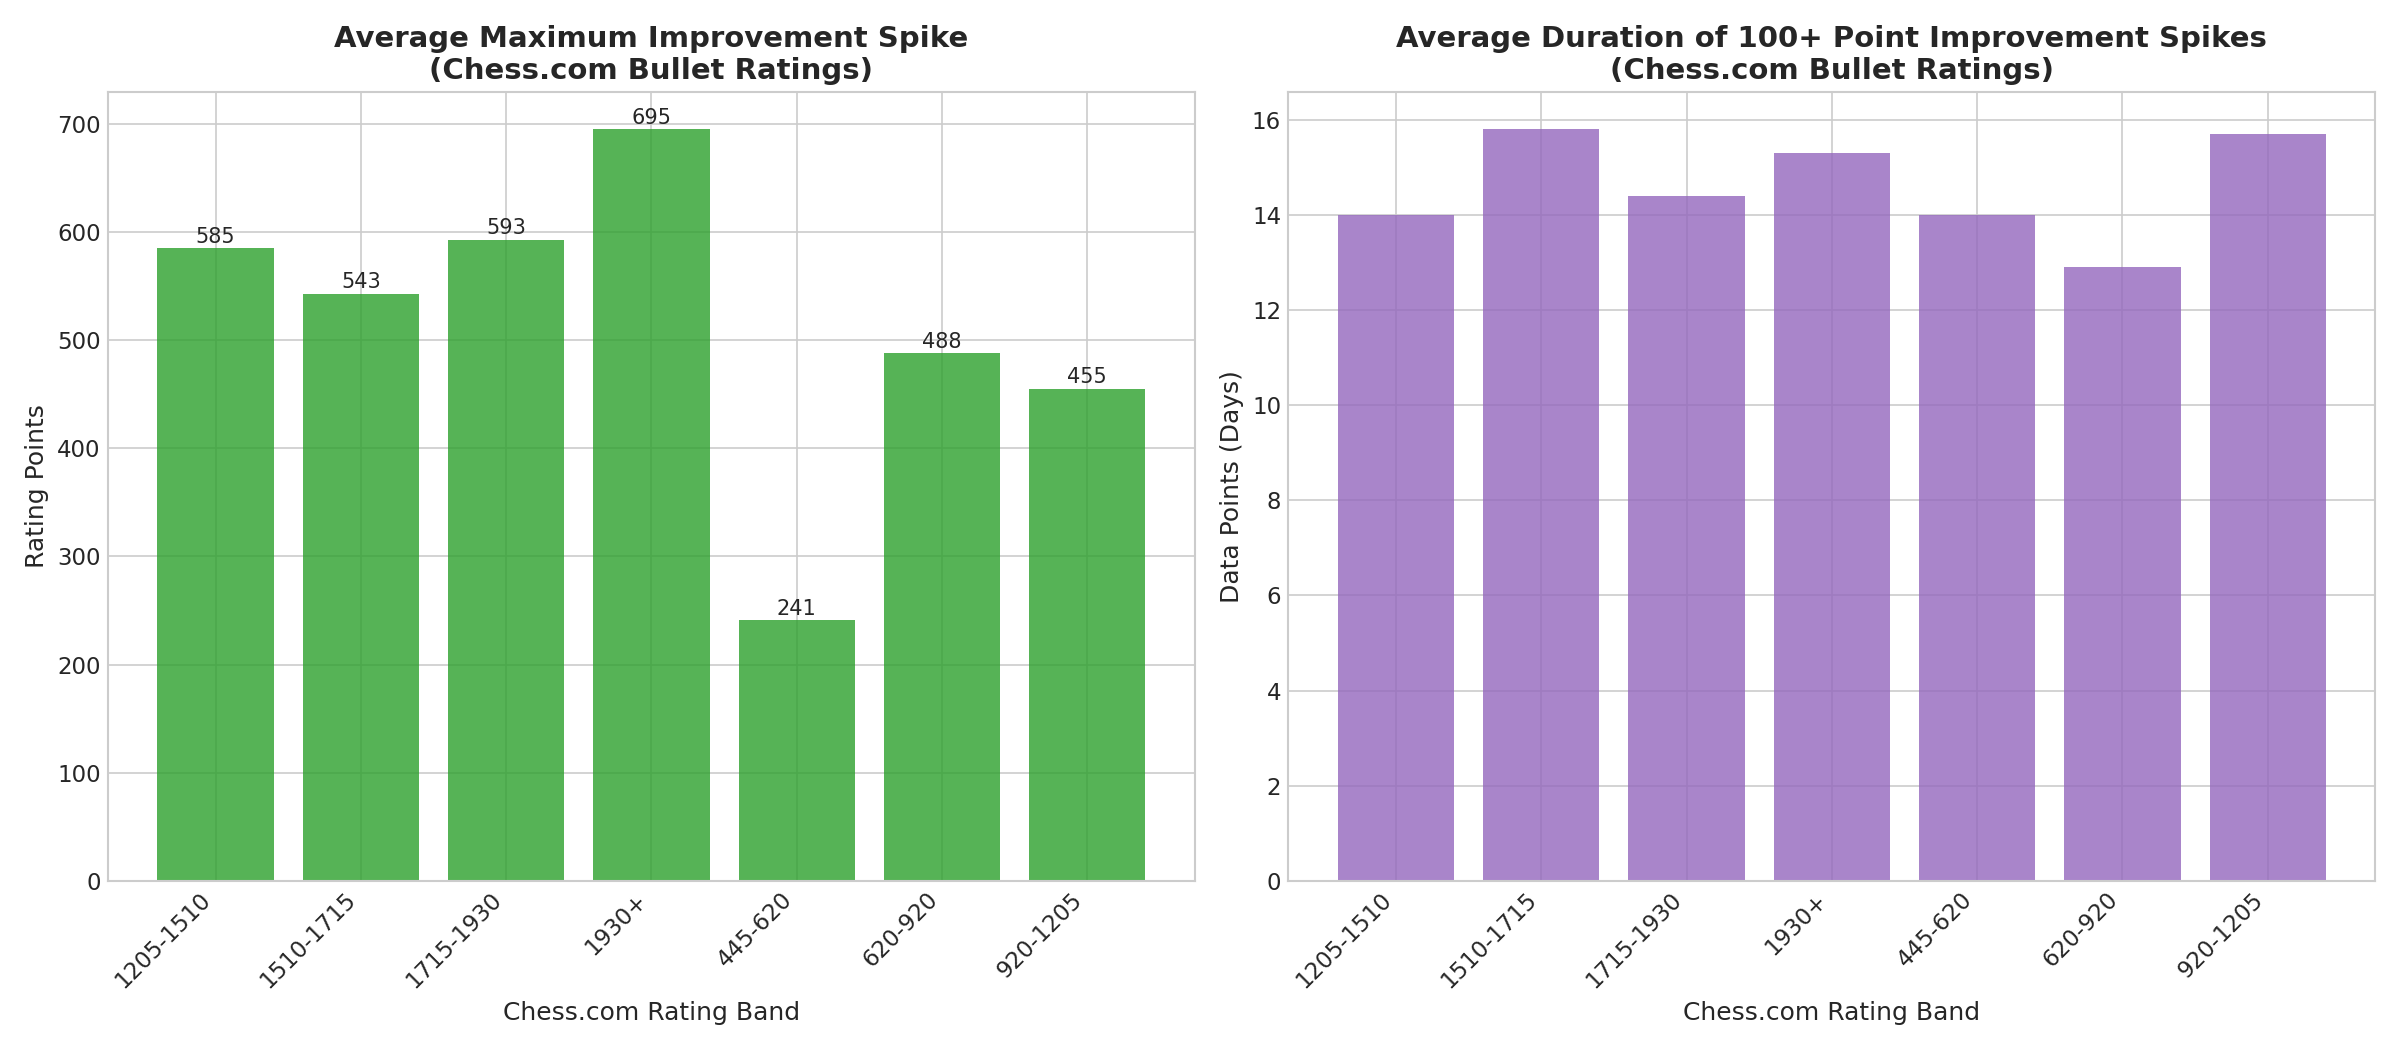
The average maximum improvement spike (a rapid gain from a recent trough) ranges from 240 to nearly 700 points, depending on the rating band. Interestingly, these spikes typically unfold over a relatively short period—averaging about 13 to 16 active playing days. This suggests that improvement often happens when a player suddenly "clicks" with a new concept, opening, or tactical pattern, allowing them to rapidly harvest rating points until they reach a new equilibrium.
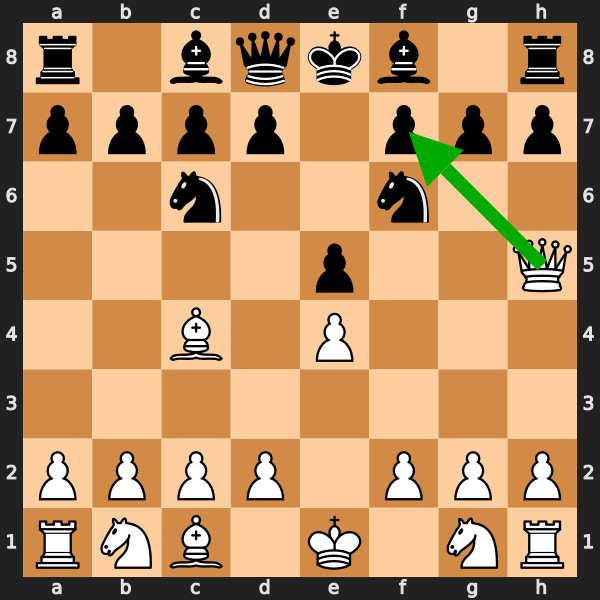 A classic example of a pattern recognition breakthrough. Recognizing the Scholar's Mate threat (Qxf7#) allows a player to instantly win games at lower levels, causing a rapid rating spike until they face opponents who know how to defend it.
Following a spike, players frequently enter a plateau. We defined a plateau as a period where a player's rating stays within a narrow 50-point band for at least 30 active days.
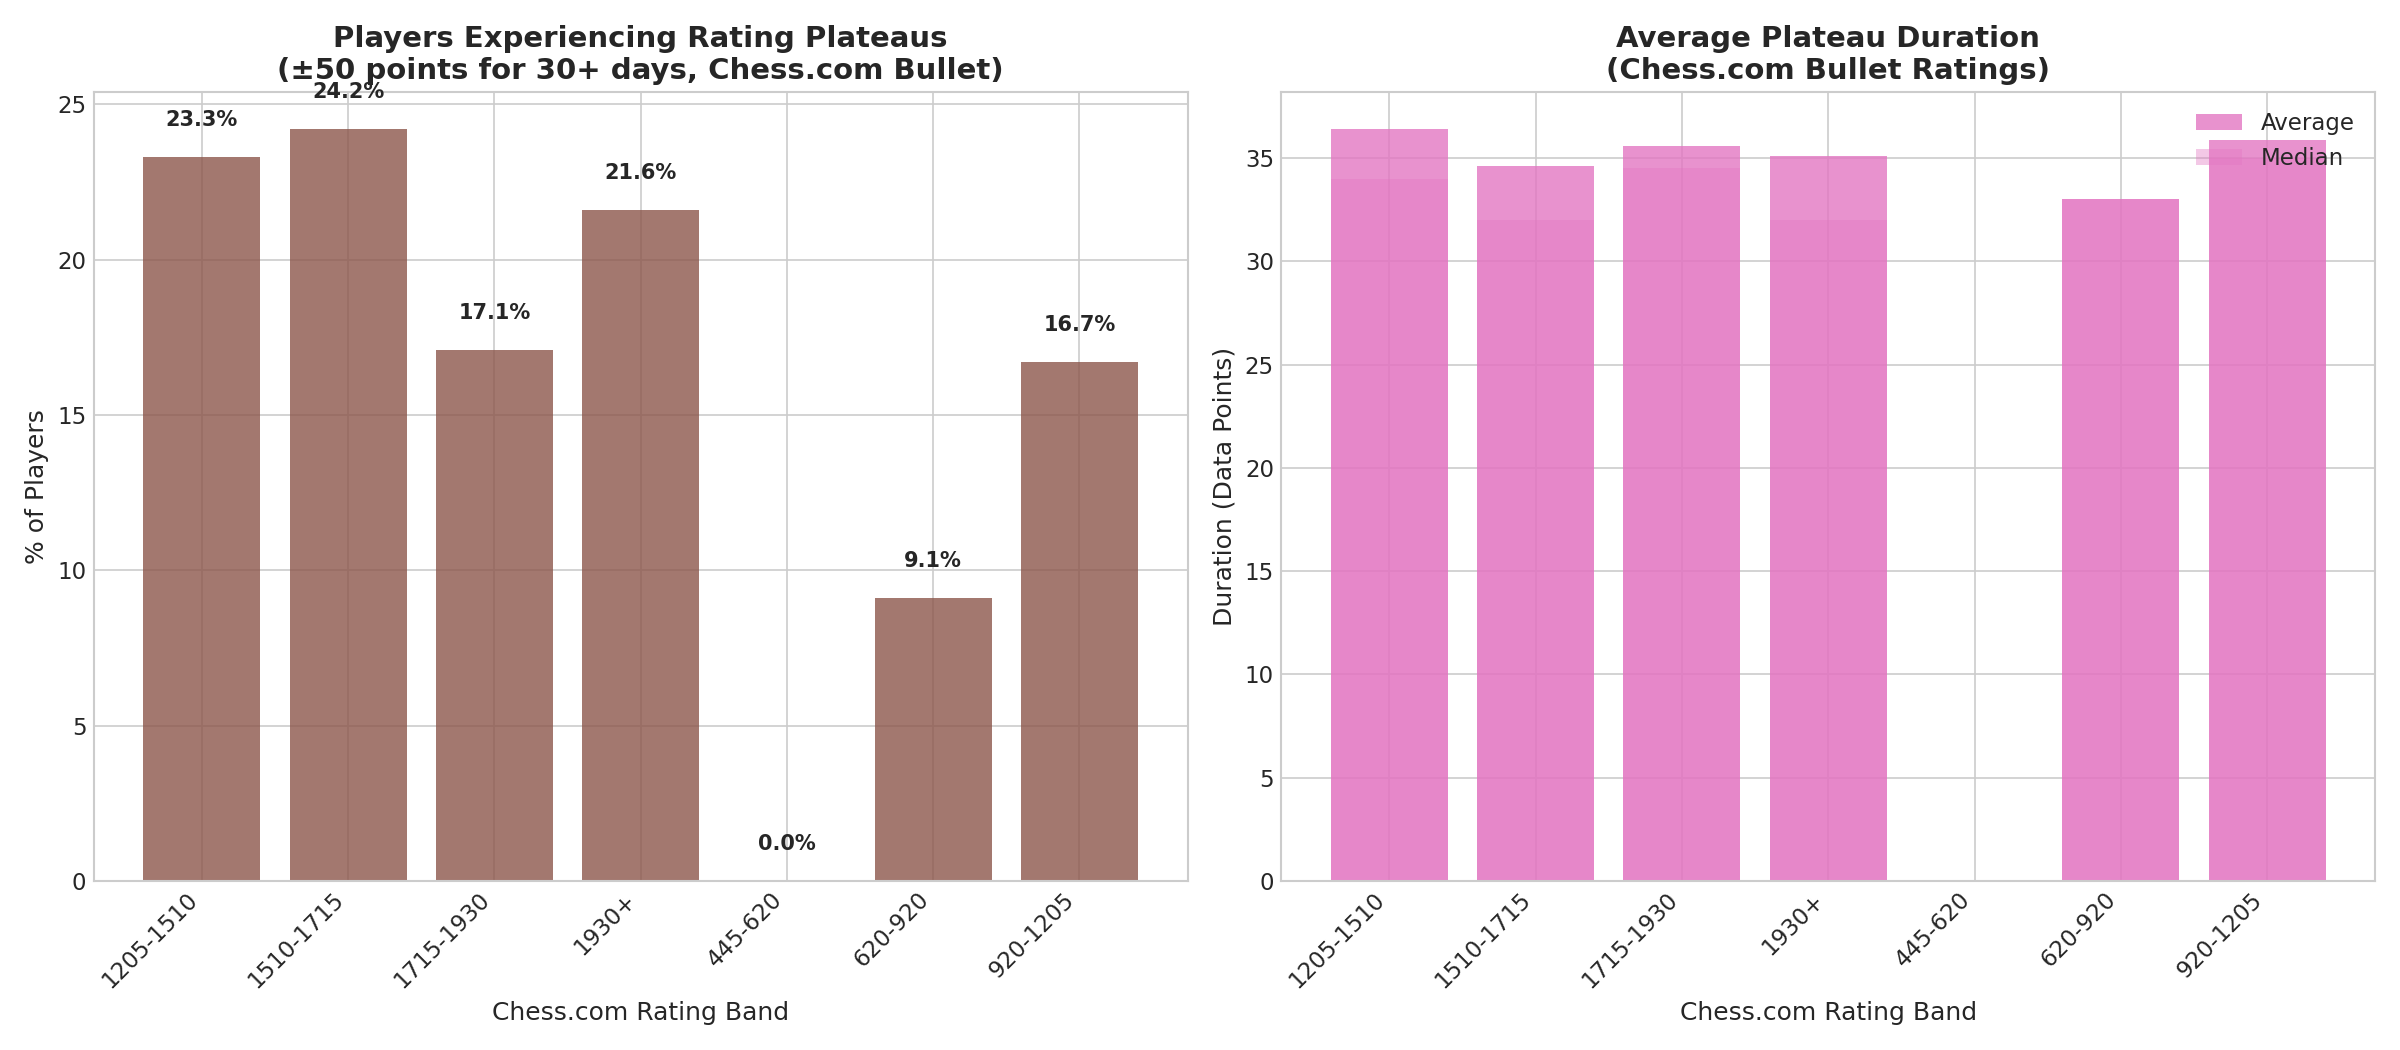
Plateaus are incredibly common, affecting roughly 15% to 25% of players in the intermediate and advanced bands. The average duration of these plateaus is around 35 active playing days. During a plateau, you are not failing to improve; you are consolidating your new skills and preparing for the next spike.
The Evolution of Variance
As players improve, the nature of their daily rating changes evolves. We analyzed the standard deviation of daily rating changes across different bands to understand how volatility changes with skill level.
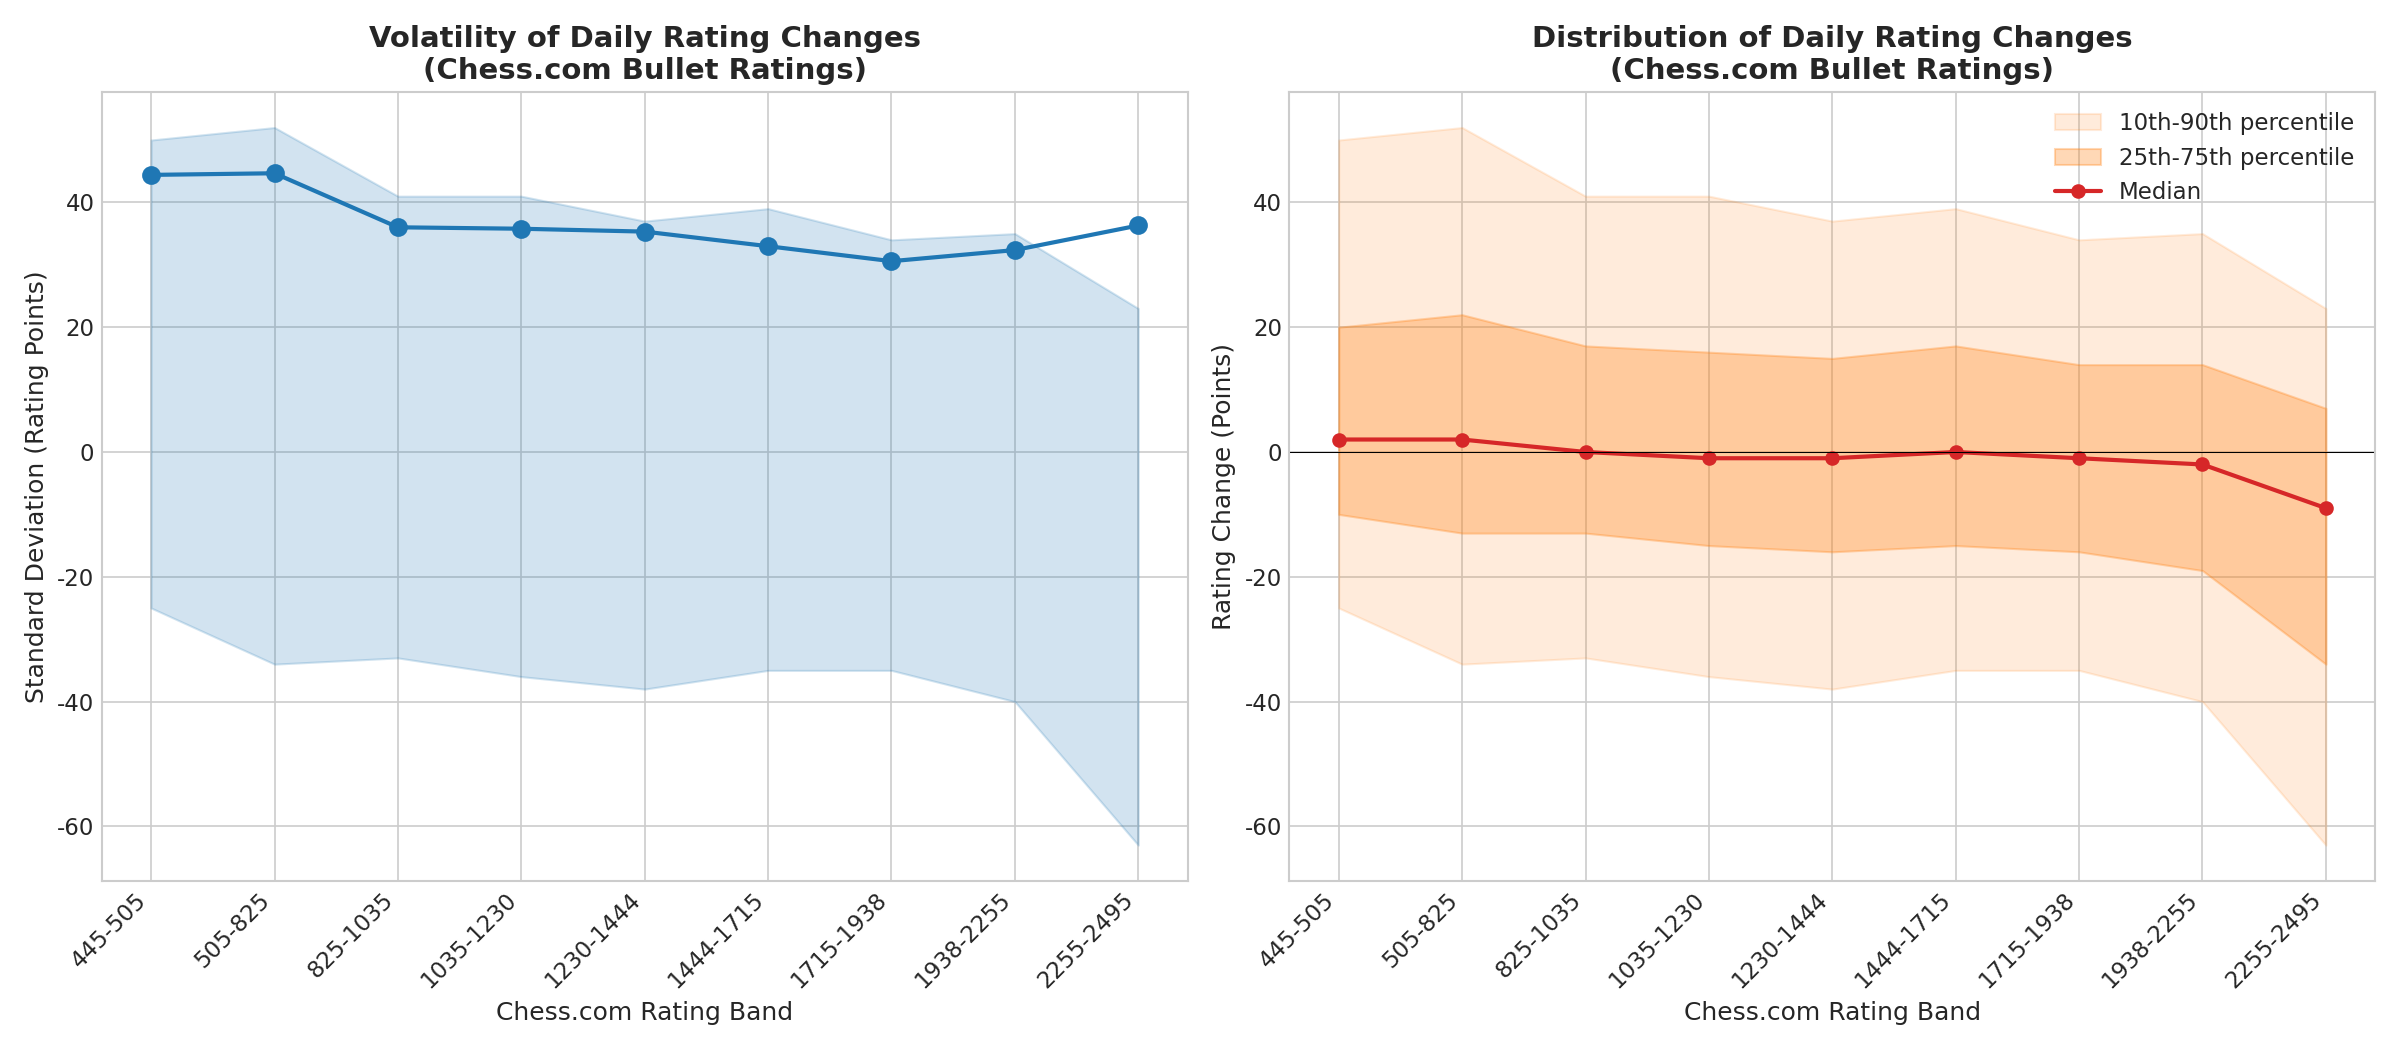
The data shows a clear trend: lower-rated players experience much higher daily volatility than higher-rated players. A player in the 445-620 Chess.com band might swing wildly by 50 points in a single session, while a 1930+ player's daily changes are much more tightly clustered around zero.
This decrease in variance is due to several factors. Higher-rated players are more consistent, make fewer outright blunders, and are less susceptible to extreme tilt. Furthermore, the rating system itself becomes less elastic as a player's rating deviation (RD) stabilizes over thousands of games.
Actionable Advice by Rating Band
Based on the data, here is a roadmap for navigating the turbulent waters of Bullet chess improvement, tailored to specific Chess.com rating bands.
800 - 1000 Chess.com (Lichess ~1100 - 1300)
The Data Reality: This band is characterized by extreme volatility. Players here experience the highest standard deviation in daily rating changes and are highly susceptible to tilt-induced losing streaks.
The Primary Obstacle: One-move blunders and hanging pieces. Games are rarely won by deep strategy; they are lost by dropping material.
 A typical lower-level blunder. White plays Ng5?? (red arrow) attempting a premature attack, completely hanging the knight, instead of simply castling (green arrow).
Actionable Advice:
- Embrace the Chaos: Accept that your rating will swing wildly. A 150-point drop does not mean you forgot how to play; it is just statistical noise at this level.
- Implement a Tilt Rule: Because tilt is so destructive here, set a hard limit. If you lose three games in a row, stop playing Bullet for the day.
- Focus on Board Vision: Before every move, do a quick scan: "Is the square I am moving to safe? Am I leaving anything undefended?"
1000 - 1200 Chess.com (Lichess ~1300 - 1500)
The Data Reality: Players in this band start to see more defined "Spike & Settle" patterns. They learn a new trick, spike 100 points, and then plateau as opponents stop falling for it.
The Primary Obstacle: Basic tactical blindness, particularly under time pressure. Players here know how to develop pieces but miss simple two-move combinations or back-rank threats.
![]() White plays Nd2?? (red arrow), completely missing the back-rank mate threat from the black rook. Ne1 (green arrow) was necessary to cover the weakness.
White plays Nd2?? (red arrow), completely missing the back-rank mate threat from the black rook. Ne1 (green arrow) was necessary to cover the weakness.
Actionable Advice:
- Drill Basic Tactics: Your next rating spike will come from pattern recognition. Spend time on Puzzle Rush or basic tactical motifs (pins, forks, skewers).
- Manage the Clock: In Bullet, time is a piece. Do not spend 15 seconds calculating a complex middle-game tactic only to flag in a winning endgame.
- Survive the Plateaus: When you hit a 30-day plateau, do not change your entire opening repertoire in frustration. Focus on incremental improvements in your tactical vision.
1200 - 1400 Chess.com (Lichess ~1500 - 1770)
The Data Reality: This is where the "Volatile Climber" pattern dominates. Players are improving, but the drawdowns are still severe (averaging over 300 points). Plateaus become more frequent and longer-lasting.
The Primary Obstacle: Endgame technique and time-scramble execution. Players here can navigate the opening and middlegame reasonably well, but games are often decided in chaotic, low-time endgames.
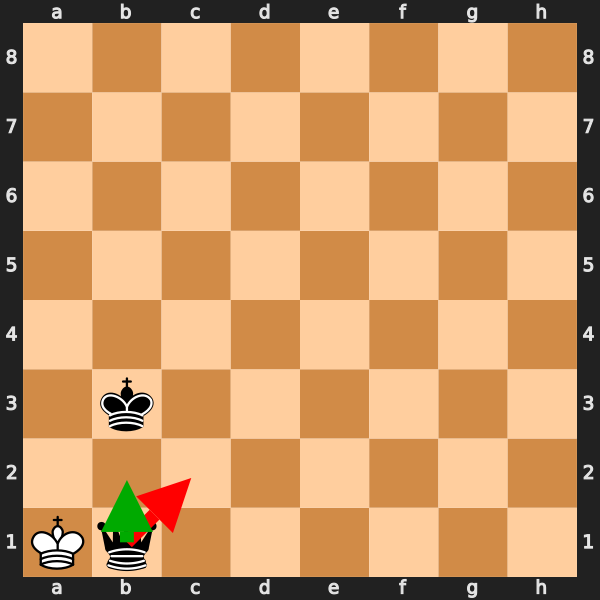 A tragic but common Bullet endgame scenario. Black, up a queen, plays Qc2?? (red arrow) resulting in a stalemate, instead of delivering the simple mate with Qb2# (green arrow).
Actionable Advice:
- Master Pre-moving: To survive the time scrambles, you must be comfortable pre-moving obvious recaptures and simple endgame patterns.
- Learn Basic Endgames: You should be able to execute a King and Queen vs. King mate, or a King and Rook vs. King mate, with less than 5 seconds on the clock.
- Analyze Your Drawdowns: When you suffer a 200-point regression, look at the games. Are you losing on time? Are you blundering in the endgame? Identify the specific cause of the tilt.
1400 - 1500+ Chess.com (Lichess ~1770 - 1850+)
The Data Reality: Variance decreases significantly here. Daily rating changes are smaller, and progress requires much more effort. The average time to progress between milestones increases substantially.
The Primary Obstacle: Consistency and opening traps. Opponents here are tactically sharp and will punish dubious opening play or slow execution.
Actionable Advice:
- Solidify Your Repertoire: You can no longer rely on cheap tricks. You need a solid, reliable response to the major openings (e4, d4) that you can play quickly and confidently.
- Review Your Losses: At this level, improvement requires targeted study. Use engine analysis to find the exact moment you lost the advantage in your games.
- Respect the Grind: Understand that gaining 50 points at this level is a significant achievement. Do not get discouraged by the slower pace of improvement.
Conclusion
The data is unequivocal: chess improvement is a messy, volatile process. Regressions of 100 or even 200 points are not signs of failure; they are a normal, expected part of the journey. Plateaus are not dead ends; they are periods of consolidation.
By understanding the statistical reality of rating trajectories, you can detach your ego from daily rating fluctuations. Focus on the process—drilling tactics, managing tilt, and learning from your mistakes—and trust that the long-term trend will take care of itself.
Data and Methodology
This analysis is based on a sample of 211 active Lichess Bullet players, encompassing over 158,000 daily rating data points. Players were selected across a wide range of rating bands to ensure a representative sample.
Because the analysis utilizes Lichess data, all rating labels in the charts and text have been adjusted to approximate Chess.com ratings using a standard conversion mapping (typically a 200-300 point difference in the relevant ranges).
The underlying data and analysis files are available for review:
View full data →username current_rating num_points start_rating end_rating min_rating max_rating net_change max_drawdown max_spike avg_daily_change std_daily_change regressions_100plus spikes_100plus ahmetyusufpinar 977 24 684 976 678 976 292 29 298 12.7 35.28 0 13 Nik_Kul_16 1011 21 1106 1011 808 1152 -95 344 236 -4.75 64.94 19 10 MatveyFrolovMsk 1038 85 1206 1038 744 1206 -168 462 364 -2.0 46.71 33 50 AndreiMogy4ii 1195 51 1420 1201 878 1420 -219 542 323 -4.38 45.19 45 19 Sunkar-1412 1066 29 1575 1064 1031 1575 -511 544 65 -18.25 36.04 28 0
View full data →username current_rating date rating daily_change ahmetyusufpinar 977 2026-01-09 684 -6 ahmetyusufpinar 977 2026-01-10 678 19 ahmetyusufpinar 977 2026-01-16 697 2 ahmetyusufpinar 977 2026-01-26 699 19 ahmetyusufpinar 977 2026-01-28 718 20
View full data →chesscom_band players pct_with_100plus_regression avg_regressions_100plus_per_player avg_regressions_150plus_per_player avg_regressions_200plus_per_player avg_max_drawdown median_max_drawdown p90_max_drawdown 1205-1510 43 97.7 299.7 115.1 37.7 342 336 505 1510-1715 33 97.0 163.5 44.0 10.7 257 247 374 1715-1930 35 94.3 316.6 103.0 29.8 299 270 475 1930+ 37 100.0 183.6 48.2 13.2 270 246 378 445-620 4 75.0 20.0 17.0 15.5 345 403 519
View full data →chesscom_band players avg_max_spike median_max_spike avg_spikes_100plus avg_spike_duration_days median_spike_duration_days 1205-1510 43 585 581 28.5 14.0 13.0 1510-1715 33 543 451 18.5 15.8 15.0 1715-1930 35 593 551 35.3 14.4 14.0 1930+ 37 695 593 23.5 15.3 15.0 445-620 4 241 267 1.2 14.0 13.0
View full data →lichess_band chesscom_band n_changes mean_change std_change variance p10_change p25_change median_change p75_change p90_change pct_positive pct_negative pct_zero 800-1000 445-505 1868 9.06 44.41 1972.04 -25 -10 2 20 50 51.7 45.8 2.5 1000-1200 505-825 4992 5.79 44.67 1995.8 -34 -13 2 22 52 51.6 46.5 1.9 1200-1400 825-1035 18793 2.39 36.01 1296.85 -33 -13 0 17 41 49.8 48.1 2.1 1400-1600 1035-1230 24957 1.2 35.78 1280.13 -36 -15 -1 16 41 48.0 50.0 1.9 1600-1800 1230-1444 25767 -0.74 35.32 1247.54 -38 -16 -1 15 37 46.8 51.1 2.1
View full data →chesscom_band players pct_with_plateau avg_plateaus_per_player avg_plateau_duration median_plateau_duration 1205-1510 43 23.3 0.5 36.4 34.0 1510-1715 33 24.2 0.8 34.6 32.0 1715-1930 35 17.1 0.5 35.6 34.5 1930+ 37 21.6 0.8 35.1 32.0 445-620 4 0.0 0.0 0.0 0.0
View full data →chesscom_band trajectory_shape count pct 1205-1510 Declining 1 2.3 1205-1510 Gradual Drift 5 11.6 1205-1510 Spike & Settle 11 25.6 1205-1510 Steady Climber 1 2.3 1205-1510 Volatile Climber 24 55.8
Chess Coach
April 15, 2026